Layer 2 Bridging with VMware NSX-T

VMware NSX-T DataCenter ships with native L2 bridging capability. If you have been running NSX for vSphere and have requirements for L2 Bridging you would be familiar with the software based L2 bridging capability which is part of the functionality of the Distributed Router.
L2 bridging has a few use-cases within the datacenter and its not uncommon to see L2 bridging being configured to allow applications that reside on overlay logical switches direct layer 2 access to machines that reside outside the logical space or to physical machines residing in a VLAN
With NSX for vSphere, this feature is provided by the Distributed router. The vSphere host that runs the Distributed router control-VM acts as the bridge instance and performs the bridging function.

In NSX-T DataCenter there are now 2 ways to bridge Overlay-VLAN networks,
* L2 bridging with ESXi host transport nodes
* L2 bridging with NSX Edge transport nodes

In this article, we will look at configuring L2 bridging using ESXi host transport nodes.

To configure an ESXi host as a bridge host we first need to create a bridge cluster. The hosts in the bridge cluster need to belong to an overlay transport zone

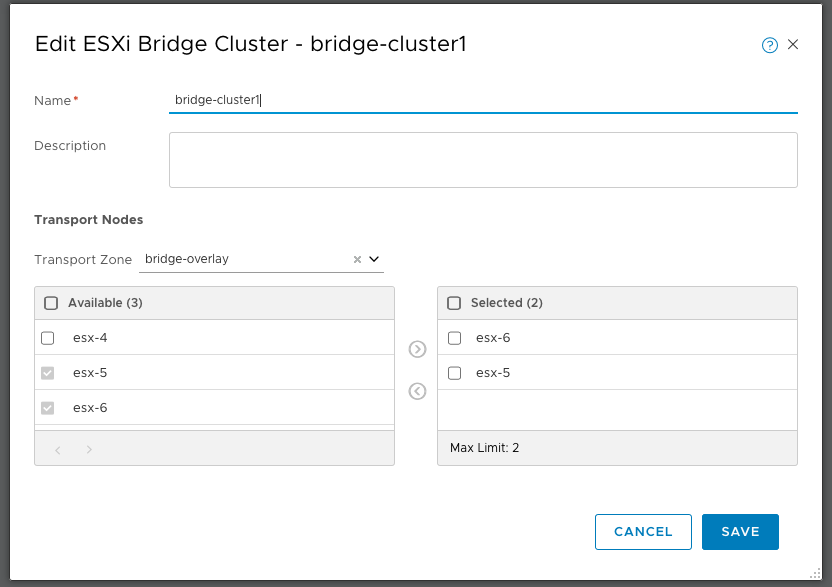
Creating the ESXi Bridge cluster

Under Fabric –> Nodes –> ESXi Bridge Clusters. Click Add and select the hosts that will act as a bridge cluster.

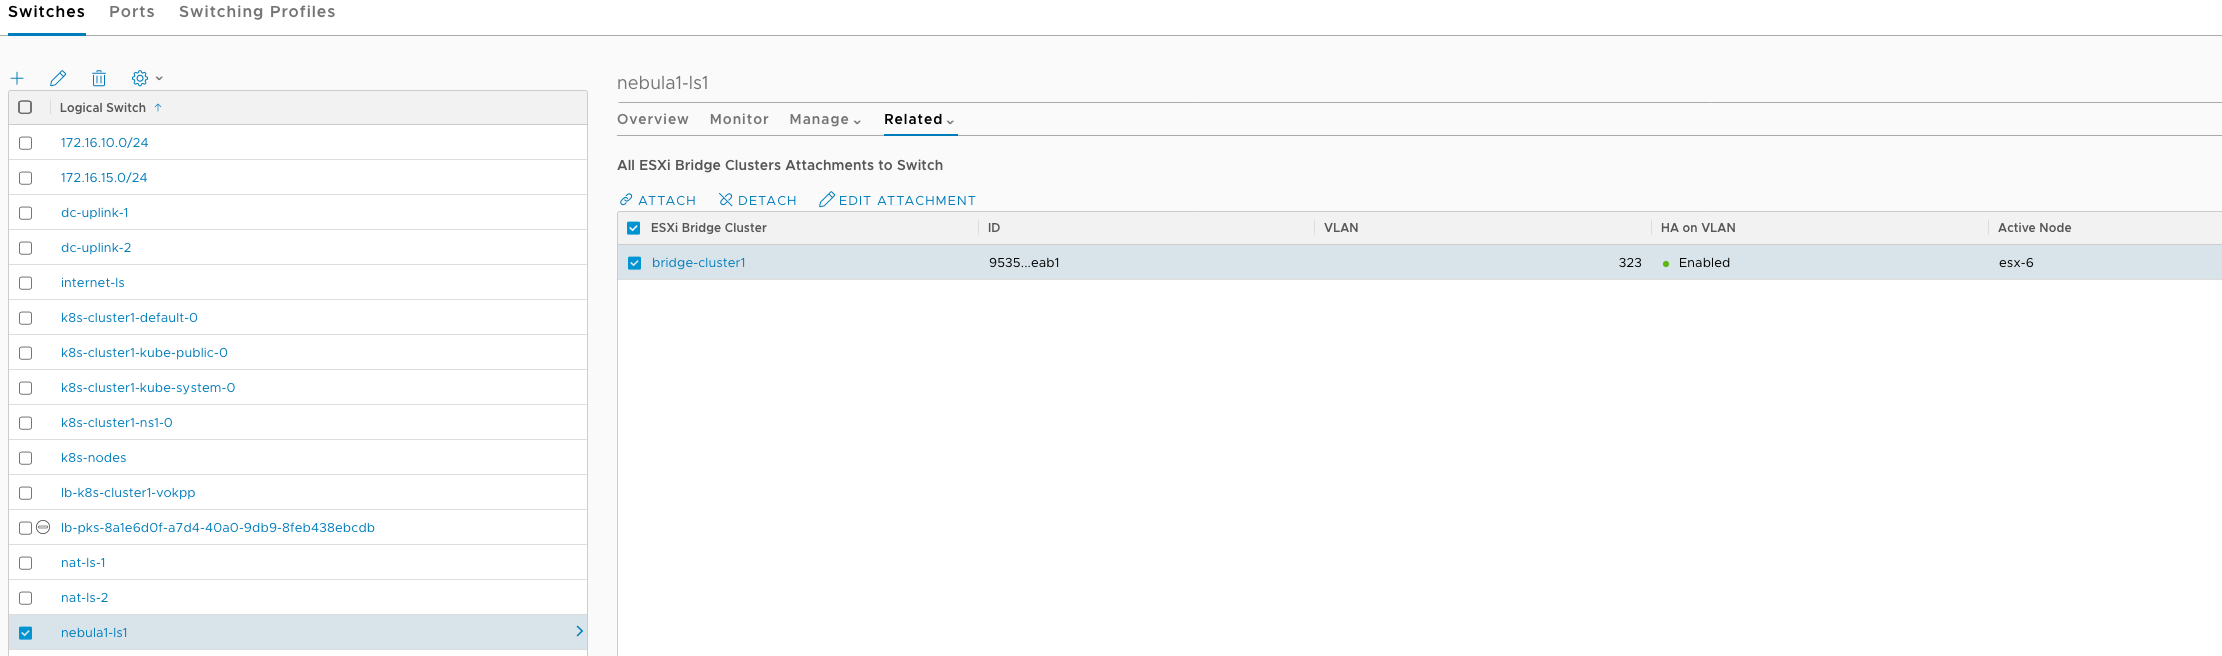
The next step is to attach this bridge cluster to the logical switch to which we want to bridge traffic. Here we specify the VLAN to bridge and turn on HA if required

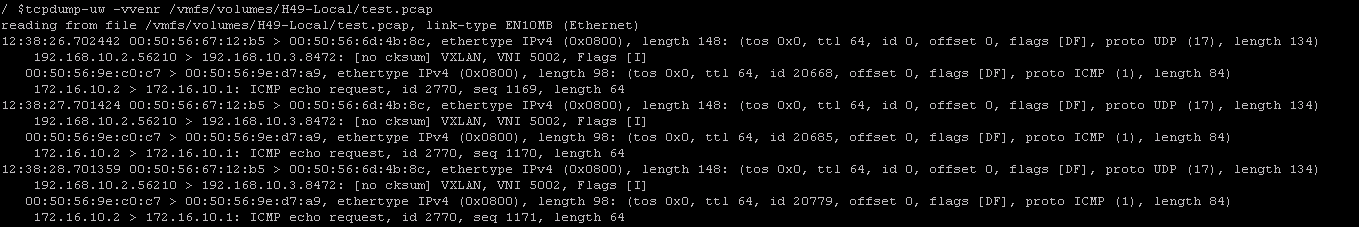
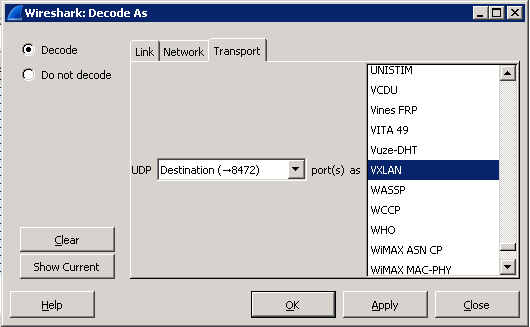
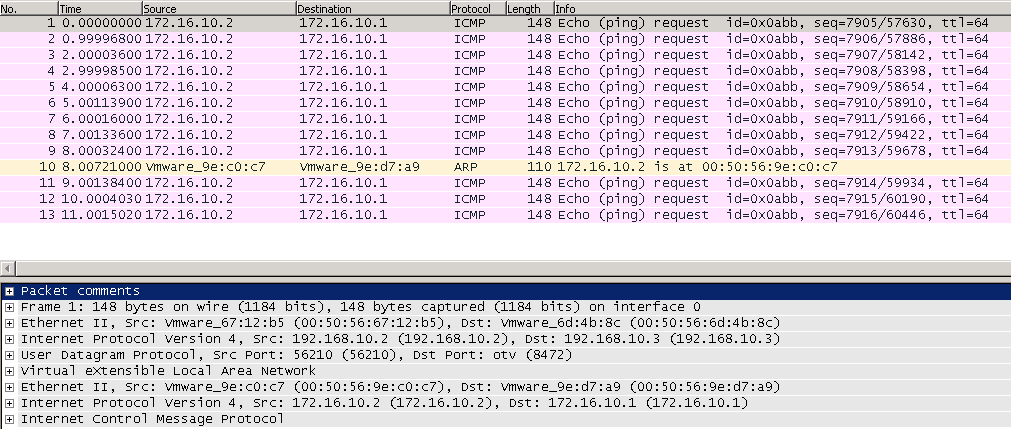
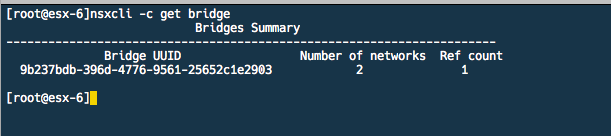
And that’s it, we should now have L2 bridge created between the overlay logical switch and the VLAN L2 segment. To validate this further we can login via SSH to the active bridge ESXi host and run the below commands,

The “nsxcli -c get bridge” command will list the bridge ID and list the number of networks on this bridge instance

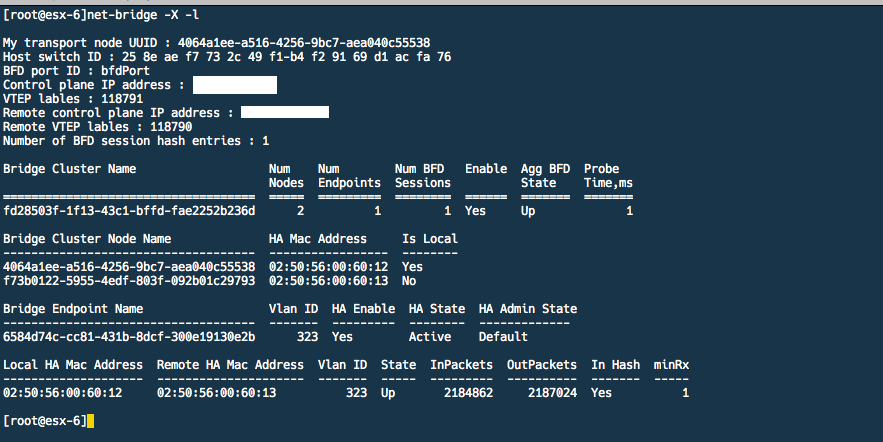
We can also run “net-bridge -X -l” which will list further information about the configured bridge. In this case, we can validate if BFD is up, state of the bridge,  the VLAN ID that is being bridged, the bridge nodes in this bridge cluster and also some stats on the number of packets ingressing/egressing this bridge instance.

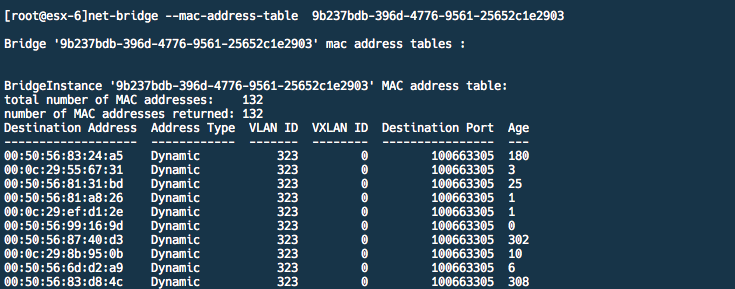
As our bridge instance state is UP we can validate if the bridge is learning MAC addresses in the VLAN segment using the “net-bridge –mac-address-table <UUID>” command

Summary

In summary, NSX-T DataCenter provides the flexibility to bridge overlay networks with VLAN networks if you have the requirement to do so.
As bridging is done in software performance is the biggest concern with this solution. To mitigate performance issues the design should look at spreading out the load across multiple bridge instances.

Promiscuous mode with NSX Distributed firewall

TL;DR – When running appliances that require promiscuous mode it’s advised to place the appliance in the DFW exclusion list, especially if the appliance is a security hardened virtual appliance

Last year I was working with a customer that had rolled out NSX to implement micro-segmentation. This customer is a mid-sized customer that is integrating NSX into their existing production vSphere environment. The customer had decided to implement security policy based on higher level abstractions i.e. security groups but also decided they need security policy enforced everywhere, using the Applied To column set to Distributed Firewall. Not an ideal implementation but perhaps that discussion is for another blog post

The environment being a brownfield environment, the customer wanted to implement security policy to the existing virtual appliances. They were using F5 virtual appliance for load balancing and had specific requirements to configure promiscuous mode on the F5 port group to support VLAN groups(https://support.f5.com/kb/en-us/products/big-ip_ltm/releasenotes/product/relnotes_ltm_ve_10_2_1.html)

Long story short, by configuring the F5 port groups in promiscuous mode they were facing intermittent packet drops across the environment. We were quickly able to identify that the workloads impacted were the workloads that resided on the host that had the F5 virtual appliances. As we could not power off the appliance we decided to place the F5 appliance in an exclusion list and like magic, everything returned to normal, no packet drops.

Well now that we understood what was causing the issue but as with all things we needed to understand why this behaviour was seen. We started by picking a virtual machine on the F5 host and turned up logging on the rule that allowed traffic for a particular service, in this case, SSH. We also added a tag to that rule so we could filter the logs.

We started to follow an SSH session that we initiated from 10.68.0.250 to 10.68.145.170. We were seeing the SYN from 10.68.0.250 reaches 10.68.145.170 and this is allowed by the firewall as rule 1795 permits it but interestingly enough we were also seeing the same traffic flow on a different filter, in this case, 53210


/var/log/dfwpktlog.log
T01:29:48.363Z 28341 INET match PASS domain-c7/1795 IN 52 TCP 10.68.0.250/65448->10.68.145.170/22 S 12345_ADMIN
T01:29:48.363Z 53210 INET match PASS domain-c7/1795 IN 52 TCP 10.68.0.250/65448->10.68.145.170/22 S 12345_ADMIN


Note: You can get the filter hash for a virtual machine by running vsipioctl getfilters. Each vNIC gets a filter hash


[root@esx101:~] vsipioctl getfilters

Filter Name : nic-11240904-eth0-vmware-sfw.2
VM UUID : 50 1e 02 7b b0 88 05 47-c2 ed dd 92 22 93 12 1d
VNIC Index : 0
Service Profile : –NOT SET–
Filter Hash : 28341


Looking at the output of vsipioctl getfilters we identified that the duplicate filter (53210) belonged to the F5 virtual appliance.

We also captured packets at the switchport of the virtual machine and we see 10.68.145.170 sending a SYN/ACK back to the client, this packet was also seen on both filters. The subsequent frame shows the client immediately sending a RST packet to close the connection. This was a bit strange as the firewall rule allows this traffic and there was no other reason why the client would immediately send a RST packet

Screen Shot 2018-01-17 at 2.07.11 PM


Interestingly the dfwpktlogs had recorded packets on the duplicate filter hitting a different rule (rule 1026) and this rule had a REJECT action so a RST packet would be sent out for TCP connections


/var/log/dfwpktlog.log
T01:29:48.364Z 53210 INET match REJECT domain-c7/1026 IN 52 TCP 10.68.145.170/22->10.68.0.250/65448 SA default-deny
T01:29:48.364Z 53210 INET match REJECT domain-c7/1026 IN 40 TCP 10.68.145.170/22->10.68.0.250/65448 R default-deny


Why would traffic be hitting a different rule when the initial SYN was evaluated by rule 1795 ??

So, when a virtual machine is connected to a promiscuous portgroup its filter is also in promiscuous mode and hence its filter would receive all traffic. In this particular case, the F5 appliance was placed in security group that had its own security policy applied to it. Duplicated traffic that was sent to this filter was being subjected to this security policy. The security policy had a REJECT action configured and hence a RST packet was being sent to the client

Having identified this, we provided the customer with a couple of options to mitigate the issue.

I hope you found this article to be as interesting as this issue was to me.Until next time !!

Powercli script to run commands on ESX hosts

Recently while working with a customer on a large scale NSX environment we hit a product bug that required us to increase the memory allocated to the vswfd (vShield-Statefull-Firewall) process on the ESXi host.

There were 2 main reasons we hit this issue,
1. Due to high churn in the distributed firewall there was a significantly high number of updates the vsfwd daemon has to process
2. Non-optimized way of allocating memory for these updates caused vsfwd to consume all of its allocated memory.

Anyway the purpose of this article is not to talk about the issue but a way to automate the process of updating the vsfwd memory on the ESXi hosts. As this was a large scale environment it was not ideal to manually edit config files on every ESXi host to increase the memory. Automating this process would eliminate errors arising due to manual intervention and keeps configuration consistent across all hosts.

I started writing the script in python and was going to leverage the paramiko module to SSH and run commands. I quickly found it a bit difficult to manage the numerous host IP addresses with python so I switched to PowerCli as I could use the Get-VMhost command to get the list of hosts in a cluster.

I’ve put the script up on the github for anyone interested – script

Until next time and here’s to learning something new each day!!!

Capturing and decoding vxlan encapsulated packets

In this short post we will look at capturing packets that are encapsulated with the VXLAN protocol and how to decode them with wireshark for troubleshooting and debugging purposes. This procedure is handy when you want to analyze network traffic on a logical switch or between logical switches.

In order to capture packets on ESXi we will use the pktcap-uw utility. Pktcap-uw is quite a versatile tool, allowing to capture at multiple points on the network stack and even trace packets through the stack. Further details on pktcap-uw can be found in VMware product documentation –here

The limitation with the current version of pktcap-uw is that we need to run 2 sets of commands to capture both egress and ingress. With that said lets get to it.. In this environment I will capture packets on vmnic4 on source and destination ESXi hosts.

To capture VXLAN encapsulated packets egressing uplink vmnic4 on the source host

pktcap-uw --uplink vmnic4 --dir 1 --stage 1 -o /tmp/vmnic4-tx.pcap

To capture VXLAN encapsulated packets ingressing uplink vmnic4 on the destination host

pktcap-uw --uplink vmnic4 --dir 0 --stage 0 -o /tmp/vmnic4-rx.pcap

If you have access to the ESXi host and want to look at the packet capture with the VXLAN headers you can use the tcpdump command like so,

tcpdump

This capture can further be imported into wireshark and the frames decoded. When the capture is first opened wireshark displays only the outer source and destination IP which are VXLAN endpoints. We need to map destination UDP port 8472 to the VXLAN protocol to see the inner frames

To do so, open the capture with Wireshark –> Analyze –> Decode As

vxlan_decode

Once decoded wireshark will display the inner source and destination IP address and inner protocol.

vxlan_decap

I hope you find this post helpful, until next time!!

Removing IP addresses from the NSX IP pool

I was recently involved in a NSX deployment where the ESX hosts (VTEPs) were not able to communicate with each other. The NSX manager UI showed that few ESX hosts in the cluster were not prepared even though the entire cluster was prepared. We quickly took a look at the ESX hosts and found that the VXLAN vmk interfaces were missing but the VIBs were still installed. Re-preparing these hosts failed with no IP addresses available in the VTEP IP pool.

To cut a long story short, We had to remove some IP addresses from the IP pool and apparently there is no way to do this from the NSX UI without deleting and re-creating the IP pool. Even with deleting and re-creating the IP pool, you can only provide a single set of contiguous IP addresses. Fortunately there is a Rest API method available to accomplish this.

So to remove an IP address from the pool we first need to find the pool-id. Using a Rest client run this GET request to get the pool-id

https:///api/2.0/services/ipam/pools/scope/globalroot-0

The output would list all the configured IP pools. We need to look at the objectId tag to get the pool-id. Once we have the pool-id we can query the pool to verify the start and end of the IP pool

https:///api/2.0/services/ipam/pools/ipaddresspool-1

To remove an IP address from this pool use the Delete method along with IP address like so,

https:///api/2.0/services/ipam/pool/ipaddresspool-1/ipaddresses/192.168.1.10

Note: With this method you can only remove IP addresses that have been allocated and not free addresses in the pool.